While politicians continue to disagree on how to revive the struggling US economy, there is consensus that the real estate market has turned around. As a matter of fact, there has been a substantial improvement of housing data all over the Nation.
Realtor Magazine reports that 2012 has been the turn-around year for housing. According to the October RE/MAX National Housing Report there were 18% more closed home purchases in October 2012 than a year ago. And FHFA (the Federal Housing Finance Agency) cites a rise in home prices of 4% year over year.
Of course, all real estate is local. To show you how the national home sales data compare to Greater Columbus and specifically to the Dublin area, we will write monthly posts (like this one) providing our readers with updates and commentary on the Dublin Housing Market.
Every month the Columbus Board of Realtors (CBR) publishes home sales data for the 18 county region covered by our MLS. Based on their most recent report (Oct 2012), sales of existing homes jumped by almost 25% as compared to October 2011.
Dublin Housing Statistics
The following link displays the Dublin Housing Report for October 2012 (pdf). This report covers the incorporated areas (the City of Dublin).
There’s another Report for the Dublin City School District.
What’s the difference?
Dublin City Schools cover a number of subdivisions which are outside of City limits. These areas may or may not have a Dublin mailing address. City services are provided by their respective municipality. Some are located in Hilliard, Columbus, Worthington, and other neighboring communities.
2012 was an outstanding year for Dublin real estate. Here are the October 2012 statistics. All numbers are per month and relate to the same month a year ago.
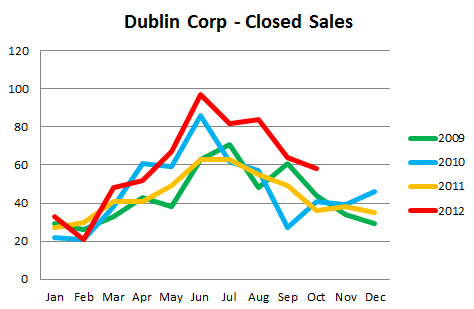
- Home sales are up by 52% – 58 sales total.
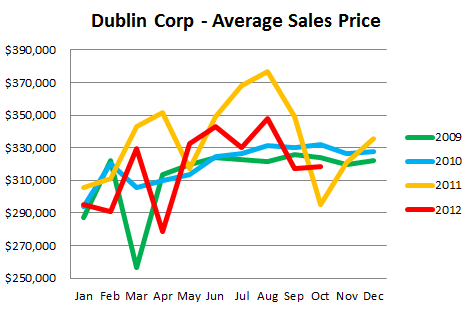
- The average sales price is $318,678 – up by 8%.
- The average price per square foot is $117.97 – up by 1.8%
- New inventory dropped to 65 listings – down by 14.5%
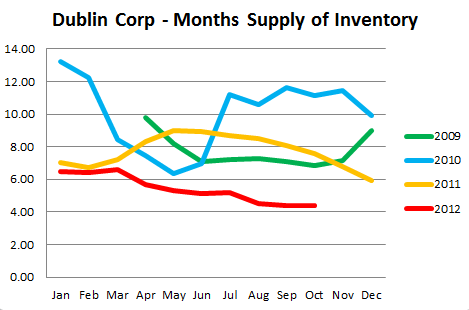
- The supply will last only 4.5 months.
The shrinking inventory of Dublin homes for sale is a major concern. The chart at the top of this article shows how the number of listings dropped from 466 in early 2011 to only 251 in October 2012.
Closed Real Estate Transactions
The next chart compares the number of real estate transactions. It shows sales closed in Dublin each month starting January 2009 to October 2012. You can clearly see that every year closings spike in June and bottom out in January and February. You can also see that 2012 (red line) was well above the 3 previous years in the number of homes sold.

Average Sales Price
The average sales price has stayed pretty level over the past 4 years. Although the sales price is up in October, the average value of a home sold in Dublin has dropped by 5% in 2012 (as of October).

Months of Supply of Inventory
This chart shows how long it would take to completely sell the current inventory of listings. In 2010 we had a one year supply of homes. Due to the increase in monthly sales, the lack of new-builds and the extremely low inventory, the supply has shrunk to merely 4.5 months.

Dublin real estate statistics show that the housing market is at the start of a new upswing. Home prices have been stable throughout the downturn. The low inventory combined with a higher demand may lead to substantial price increases over the next couple of years, until builders catch up and supply more inventory.
Until then, it is a good time to list your house!
