Are you very analytical? Do you like to look at charts and study the numbers?
Then this post is definitely for you.
You may have heard earlier this week that Columbus home sales dropped by more than 30% in October. It was published by a number of news organizations. Here’s the original news release from the Columbus Board of Realtors about how the Ohio housing market of 2010 is mirroring the results of 2009.
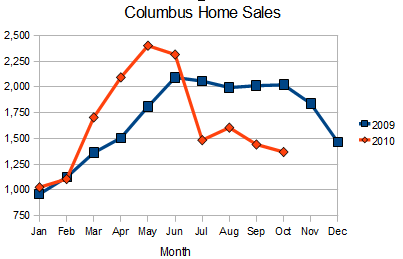
Mirroring means that the second half of 2009 was above normal, and the first half of 2010 was above normal, as you can see from the chart below. This chart compares Central Ohio home sales in 2009 (blue) to sales in 2010 (red).
 They found that during the times of the first time home buyer tax credit – the second half of 2009 and the first half of 2010 – home sales increased substantially. Everyone was excited for the rebounding housing market. Unfortunately, these results were only temporary. You could say they are a result of government intervention – the tax credit.
While the first half of 2010 was far better than a year ago, the second half will be worse. At the end, the number of home sales will be very similar for both year. As of October 2010 the number of homes sold year-to-date are almost identical.
Most home buyers decided to move forward at the beginning of the year to take advantage of the tax credit. That leaves fewer home buyers for the rest of 2010.
I am not surprised, as these stats are reflected in my own real estate business. As a matter of fact, I could have predicted these results based on the number of calls I received from home buyers during the past 3 months.
The table below shows the October numbers. They are very telling: 700 homes less sold in October 2010 vs October 2009. And the total sales volume was $100 million less than a year ago.

If you look at the Year-to-Date Performance which is in the lower half of this table you can see that the totals for 2010 are not much different than 2009.
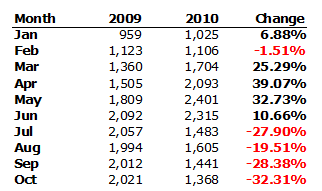
I summarized these numbers in this table, which is the same like the chart at the beginning of this article. It shows the number of homes sold every month for 2009 and 2010. The elevated volume at the end of 2009 and a bump at the beginning of 2010 represent the impact of the home buyer tax credit.

Would like to study more data like these? Check the Housing Statistics at the Columbus Board of Realtors website.
Any questions about these stats? Feel free to give me a call at (614) 975-9650 and I’ll help you decypher the numbers.
Thanks for reading the susannenovak.com Blog!
Posted by: Susanne Novak, ABR, FIS, GRI
Columbus Real Estate Agent helping First Time Buyers.
(614) 975-9650
