Most housing data I share on my blog cover the Columbus Metro Area. Sometimes I write about specific suburbs, like Dublin or Powell and neighborhoods such as Muirfield Village. Most of these data represent averages of very large areas.
Everybody know that real estate is local. Every subdivision or neighborhood experiences different trends. So, I decided to create Hyper-Local Housing Market Stats for Columbus neighborhoods.
Why You Need Hyper-Local Housing Market Stats
Each city is made up of many different subdivisions. Typically, subdivisions are developed by one or two builders. Most subdivisions consist of houses of similar size, style and price range. That’s why we always pick homes from the same subdivision when we prepare a comparative market analysis (CMA) for home sellers.
Hyper-local data show home sales and pricing trends for one specific subdivision. They present the most relevant information for home owners who consider buying or selling.
Hyper-Local Data for the Northwestern Subdivisions
You can imagine that it is almost impossible to compile hyper-local housing data for the hundreds of subdivisions all over Columbus. I had to limit myself to 25 popular ones in Northwest Columbus, Dublin and Powell.
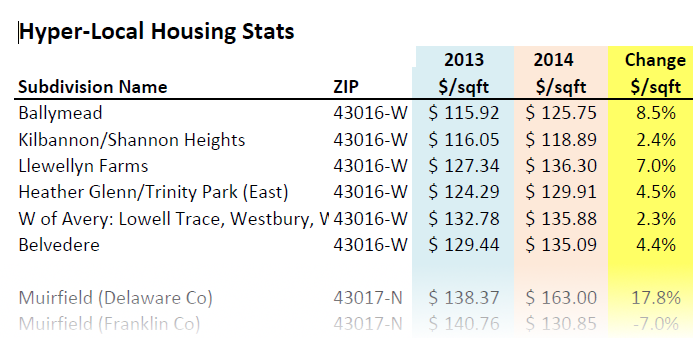
Click here to download a list of the subdivisions I covered, so far (pdf). Some are small, and may only have a few sales every year. Others contain a thousand homes or more, and boast 30 to 40 sales, each year. Below is a small sample of the full list.
In the full table you will find the number of homes sold, the average square footage, the average sales price, the price per sqft, and the days on market (DOM). I compiled data for 2013 and 2014. The % change indicates how much the average sales price and the average price per sqft have changed between 2013 and 2014.
Please note: If only 3 or 4 homes sold in a subdivision, the % change may not be a true representation of home value trends.
What the Numbers Mean
Let’s look at an example. In the Llewellyn Farms Subdivision in Dublin OH, the average sold price of a homes was $376,610 in 2014, which indicates a 21.9% increase over 2013 (average 2013 price: $308,925).
The average price per sqft increased by 7% from $127.34 in 2013 to $136.30 in 2014. At the same time the days on market (how long it took a home to get in contract) decreased from 58 in 2013 to 41 days in 2014.
The best indicator of the current value of your home is the price per sqft. Multiply it with your square-footage and you should get a fair estimate of what your home may be worth.
But that’s not all. The real value of your home depends on many individual factors, including recent upgrades, its condition, the location of the home in the subdivision and much more.
In order to get the most accurate estimate of your home’s value, I will need to consider all of this information and compare it to the condition of recently sold properties.
How to Get Hyper-Local Housing Market Stats?
If you would like to know the hyper-local housing market stats for your neighborhood or get an accurate estimate of the value of your home, please email your address and the name of your subdivision. I will prepare a custom report for you!


