
While home sales have slowed down in many parts of the country during the month of May, the Columbus housing market is still red hot.
Closed sales, pending contracts, and sales prices are up by double digits. Even New Listings have increased by 20.7% in May as compared to a year ago.

Detailed Charts on My New Housing Data Webpage
I just launched a new Housing Data webpage to make it easier for you to see what’s going on in our market.
The charts show the housing stats published by the Columbus Association of Realtors and will be updated every month. You can easily compare the latest data to previous years going back to 2017.
Click here to check it out.
Market Share & Days on Market over the Past 10 Years
Some of you may still remember how we began pulling out of the Great Recession 10 years ago. The market was full of bank owned properties. In average, it took 102 days to sell a home.
17,603 homes were listed for sale in May of 2011.
Currently, there are only 2,228 active listings on the MLS.
Below you can see how Closed Sales and Days on Market (DOM) have changed for different price ranges since 2011.
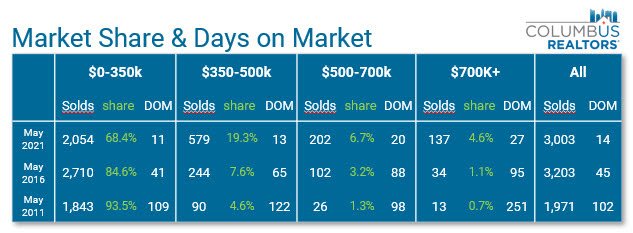
Sales of expensive homes have increased substantially over the past 10 years, as you can see in the 3 pie charts below. Red represents properties that sold above $750,000, blue shows homes priced below $350,000.

Days on Market plummeted by close to 90% in all price ranges since 2011.

Housing Stats for May 2021
Here’s a summary of home sales data for May 2021 as reported by the Columbus Association of Realtors:
- Closed Transactions – 3,003 – UP by 18.1%
- Inventory – 2,068 – DOWN by 35.6%
- New Listings – 3,900 – UP by 20.7%
- Days on Market – 14 – DOWN by 50.0%
- Average Sales Price – $315,127 – UP by 21.8%
- Average Price / Sqft – $169.05 – UP by 19.5%
Go to Columbus Realtors to see the full report.
This may be the best sellers’ market of your lifetime.
Don’t miss it!
Call or Text me NOW at (614) 975-9650!